Joint quantile regression with operator-valued kernels
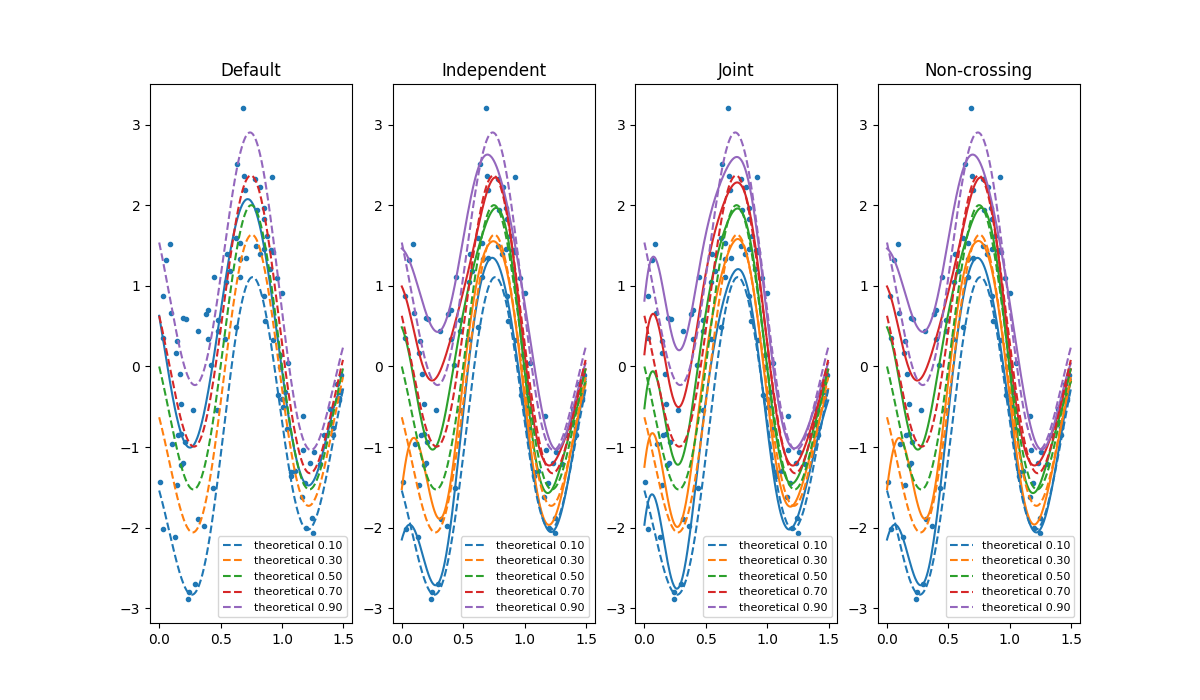
An example to illustrate joint quantile regression with operator-valued kernels.
We compare quantile regression estimation with and without non-crossing constraints.

Out:
Creating dataset...
Fitting...
Default
Default leaning time: 0.0966 s
Default score 0.69466
Independent
Independent leaning time: 2.3363 s
Independent score 0.78161
Joint
Joint leaning time: 5.3037 s
Joint score 0.78496
Non-crossing
Non-crossing leaning time: 9.8599 s
Non-crossing score 0.78167
# Author: Maxime Sangnier <maxime.sangnier@gmail.com>
# License: MIT

# -*- coding: utf-8 -*-
import time

import numpy as np
import matplotlib.pyplot as plt

from operalib import Quantile, toy_data_quantile


def main():
    """Example of multiple quantile regression."""

    print("Creating dataset...")
    probs = np.linspace(0.1, 0.9, 5)  # Quantile levels of interest
    x_train, y_train, _ = toy_data_quantile(100, random_state=0)
    x_test, y_test, z_test = toy_data_quantile(1000, probs=probs,
                                               random_state=1)

    print("Fitting...")
    methods = {'Default': Quantile(),
               'Joint':
               Quantile(probs=probs, kernel='DGauss', lbda=1e-2, gamma=8.,
                        gamma_quantile=1e-2),
               'Independent': Quantile(probs=probs, kernel='DGauss',
                                       lbda=1e-2, gamma=8.,
                                       gamma_quantile=np.inf),
               'Non-crossing': Quantile(probs=probs, kernel='DGauss',
                                        lbda=1e-2, gamma=8.,
                                        gamma_quantile=np.inf, nc_const=True)}
    # Fit on training data
    for name, reg in sorted(methods.items()):
        print(name)
        start = time.time()
        reg.fit(x_train, y_train)
        print('%s leaning time: %.4f s' % (name, time.time() - start))
        print('%s score %.5f' % (name, reg.score(x_test, y_test)))

    # Plot the estimated conditional quantiles
    plt.figure(figsize=(12, 7))
    for i, method in enumerate(sorted(methods.keys())):
        plt.subplot(1, 4, i + 1)
        plt.plot(x_train, y_train, '.')
        plt.gca().set_prop_cycle(None)
        predictions = methods[method].predict(x_test)
        if predictions.ndim < 2:
            plt.plot(x_test, predictions, '-')
        else:
            for quantile in predictions:
                plt.plot(x_test, quantile, '-')
        plt.gca().set_prop_cycle(None)
        for prob, quantile in zip(probs, z_test):
            plt.plot(x_test, quantile, '--',
                     label="theoretical {0:0.2f}".format(prob))
        plt.title(method)
        plt.legend(fontsize=8)
    plt.show()


if __name__ == '__main__':
    main()
Total running time of the script: ( 0 minutes 19.419 seconds)